A few week’s ago, I wrote about SEIA’s solar market research and what this means for you, the solar contractor. Recently, IREC released their annual solar market report with the optimistic title: “Solar Markets in the US: Big, Booming, And Oh So Bright”
I wanted to share with you a few highlights directly from the report, feel free to read it all if you want, and digest some of the information into what you should walk away with 3 critical takeaways. Read past the break for full details and join HeatSpring on facebook to keep up to date on events, tips, resources and news. If you’re a clean energy professional, request to join HeatSpring’s linkedin group for Clean Energy Professionals
My Top Highlights Quoted Directly From the Report
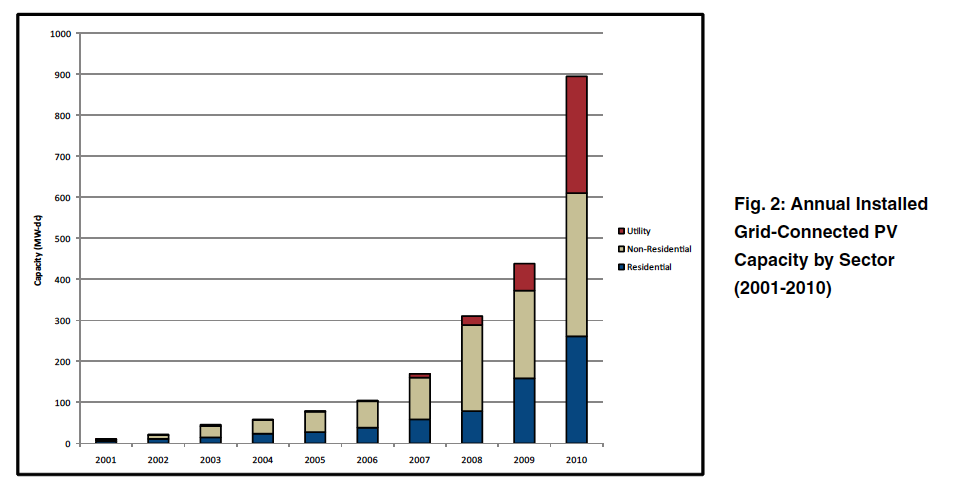
- The capacity of photovoltaic (PV) installations completed in 2010 doubled compared to the capacity installed in 2009.
- PV capacity installed in 2010 quadrupled in the utility sector and grew by over 60% in the residential and non-residential sectors. State renewable portfolio requirements are an important reason for the large growth in the utility sector.
- 28% of the U.S. installed capacity completed in 2010. However, this is a significant drop in market share from the 49% recorded in 2009.
- There were 6% more solar water heating installations (low temperature thermal) completed in 2010 than in 2009. Eighty four percent of these installations are in the residential sector.
- Early indicators point to continued market growth in 2011 due to the long-term extension of the federal solar investment tax credit (ITC), recent federal legislation that allows utilities to take advantage of the ITC, and a deadline to start construction by the end of 2011 to participate in the federal cash grant program.
- State financial incentives continue to be an important factor, especially for residential and commercial distributed installations. Of the top ten states for PV installations, six have state or utility rebate programs that are the most significant driver in those markets. The federal incentives are important, but they are generally insufficient to create a market by themselves.
- Of the ten largest PV installations in the U.S., six were installed in 2010.
- Residential installations increased by 64% and accounted for 29% of all PV installations in 2010. Residential installation growth has been dramatic each year for the past five years, with annual growth rates between 33 and 103%. Federal incentives for residential installations are stable, with no changes made in 2010 and current incentive levels set until 2016.
What does this mean for you, the solar contractor?
- The 1603 Grant Program is set to expire at the end of 2011. However, commercial and utility projects that use a tax equity and more complex ownership structure to finance solar projects. The residential market should stay relatively unaffected on the federal level and will only be impacted by state policy until 2016. Good news for (most) of you.
- Competition: The growth of solar industry may make you afraid. While competition is getting more intense, realize that the industry did not really exist 5 years ago, and there is still ample room for more solar installation companies.
- The combination of the grant program and competition reveal an important trend for the opportunity in the residential market. The vast majority of installations, well over 90% are residential (figure 5) while the installed wattage is split between utility commerical and residential (figure 2). If you’re a solar contractor, there is plenty of space for you in the residential market.


