
Source: http://www.slideshare.net/davidfparker/estimating-uncertainty
This article is part of a series of interviews, tutorials, and definitions around commercial solar financing that is leading up to the start of our next Solar MBA that starts on Monday September 15th. In the Solar MBA students will complete financial modeling for a commercial solar project from start to finish with expert guidance. The class is limited to 50 students, but there are 30 discounted seats.
Financing a large commercial solar project is about understanding, controlling, reducing, and communicating risk and uncertainty.
Because solar has a variable energy source, the amount of power that an array will produce, and thus the value of that power, is highly variable and needs to be understood to finance a project. As projects get larger, more due diligence is required to understand and evaluate the potential solar production of an array.
Solar production estimates are based on a number of factors. Some factors can be controlled and modeled with a high degree of certainty and others are closer to guesses about the future. Because these are guesses, we need to state a confidence level for each guess.
The confidence level of the amount of energy a solar array will produce is measured in P50 and P90 production levels.
This article will be useful to any solar installer who sees commercial solar projects, and specifically the financing of those projects, as critical to the success of their business. For larger projects, PVWatts won’t cut it. You’ll need to understand the amount of potential revenue a solar array can generate, and your confidence in its ability to generate that revenue, in order to get investors to buy into the project.
In this article we will explain:
- The general types of production risk and why there is such a huge focus on solar radiation levels.
- The definition of P50 and P90, how it’s graphed, and the impact of weather variability.
- The potential impact of revenue expectations.
- What is critical to understand about P50 and P90.
- Further reading.
Let’s dive in.
1. Types of Risk
There are many ways to describe the risks associated with a solar array. In general, you could put them into two buckets: “construction risk” and “operating risk.”
From an investor’s perspective, construction risk is any source of risk that happens before COD, when the system is not operating. This can include site risk, site control, interconnection risk, EPC and construction risk, and more. An entire article could be written on those topics. For the most part, construction risks are about understanding and controlling the cost and time required to build the array. There are some obvious factors during the engineering and installation of the array that can have large impacts on the potential production of the array.
Operating risks are the risks associated with running the facility and generating revenue from the production of energy. These can still include some site and equipment failure or warranty risks, but, assuming those are controlled for, the major risk after a solar array has been constructed is how much power it will produce.
AWS Truepower published a report about reducing uncertainly in solar energy estimates in which they rank ordered the factors that have the largest potential impact on solar production estimates. That graph is below.
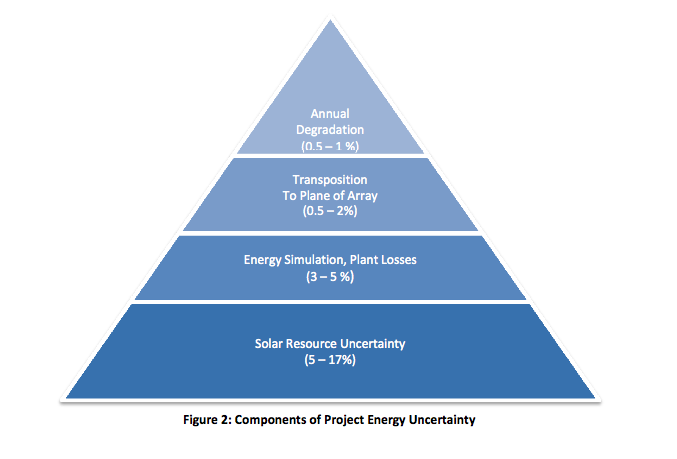
As you can see, “solar resource uncertainty” is the single largest item that can impact total solar power production based on their analysis.
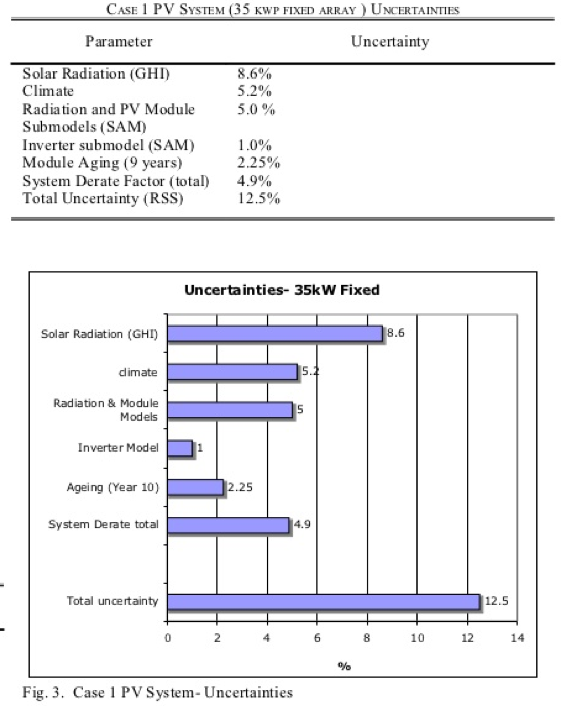
David Park from IEEE published a similar analysis. He rank ordered the impact solar radiation, climate, module model, inverter model, aging, and system derate can have on expected array production versus estimated production and found that solar radiation, climate, and radiation and module model explained the largest amount of production variability.
The value of energy produced by a solar array is a function of two items: how much energy is produced and the value of that energy. The value of that energy can be based on a number of factors: the kWh rate it’s offsetting, any net-metering laws that are in place, the negotiated PPA rate, potentially demand charge reductions, any production-based incentives, and more.
Given that we cannot predict with 100% certainty the amount of solar radiation that will hit an array over any given period of time, to understand and communicate the potential solar resource we use P50 and P90 production levels of an array.
While these production estimates rely to some degree on system design and siting, the main variable is weather.
2. The definition of P50 and P90 and how they are graphed
In P50 and P90, the P stands for probability.
P50 means there is a 50% chance in any given year that production will be at least a specific amount. If an array has a P50 production level of 500 kWh, it means that on any given year there is a 50% chance that production will be AT LEAST 500 kWh.
P90 production means that there is a 90% chance that in any given year production will be at least the specific amount. This means that there is only a 10% chance that production will be lower then the stated amount. If any array has a P90 production level of 400 kWh per year, it means that on any given year year there is a 90% chance that production will be AT LEAST 400 kWh.
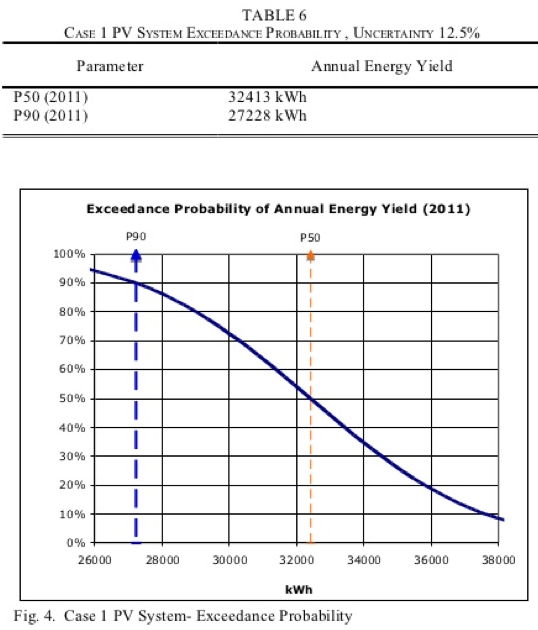
Here’s a graph of P50 and P90 production estimates from David Park’s report.
For any statistics geeks who are reading this, it will look very familiar. What he’s doing is graphing the variability of the mean in a confidence interval, in this case one standard deviation is 12.5%. P50 is the mean and P90 is a little less than two standard deviations (remember that two standard deviations is 95%) from the mean.
3. Weather Data Variability and the Relationship Between P50 and P90
Because the variability of solar production, and thus the difference between P50 and P90, is largely based on the variability of weather, extensive weather analysis must be performed to calculate these values.
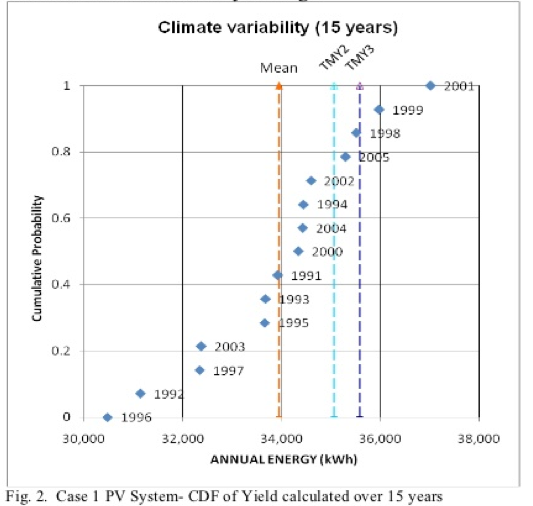
The above graph comes from the report by David Parker and illustrates how weather recordings over a specific period are used to determine the variability of irradiation for a specific location.
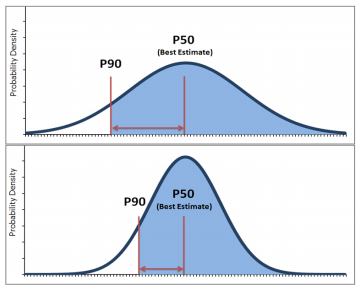
What this means for solar production is that areas that have less sporadic weather changes have closer P50 and P90 values. Statistics geeks, lower variability means a lower standard deviation across the distribution of solar irradiation values.
If you look at the two graphs below, the top graph is an illustration of an array that has highly variable weather characteristics while the bottom graph displays an array with more stable and predictable weather.
4. Potential Impact of P50 and P90 Production Estimates on Revenue Potential
The difference between P50 and P90 production levels in areas with moderately variable weather can have large impacts on the assumed production for an array.
If we want to use the example from our first graph:
P50 production was: 32,413 kWh
P90 production was: 27,228 kWh
That’s a difference of 5,185 kWh. P90 production estimates are 15.9% lower than P50 values. 15.9% is a lot!
Assume the value of a kWh is $.15 per kWh
P50 production is expected to be: $4,861
P90 production is expected to be: $4,084
If we assume that each kWh is worth exactly the same amount, this means that the value of the power produced would be expected to be 15.9% lower if P90 was used compared with P50. However, we can be much more confident that every year we’ll hit the P90 production levels. This is why investors signed into a PPA tend to favor P90 production levels if they are being paid with power production.
5. What’s critical to understand about P50 and P90?
- P50 and P90 production levels are hard to determine with software models.
- For larger projects, an engineering firm will work to perform this analysis.
- P90 is more conservative, so investors will focus on this amount. P50 is less conservative, so developers tend to focus on this.
- The greater the variability of weather in a specific area, the greater the variability between P50 and P90 because solar radiation levels explain the majority of the variability in production.
- Investors will be most concerned with production levels in legal structures where their returns are based on the production of the system. In lease structures, the investors will be less concerned with production because the payments are hell or high water payments.
6. Further Reading on Production and Risk Modeling
- Why Investors Prefer P90
- Energy Yield Predictions
- Estimating Uncertainty
- Modeling Revenue Uncertainties
- P50 and P90 Analysis Using SAM
- Reducing Uncertainty in Solar Energy Estimates
- Evaluation of PV Performance Models
[…] Modeling Solar Production Riks – P50 vs P90 Production […]
Nice article. Def very helpful.
If you are in the market for an energy forecasting software program that is second to none, then AURORAxmp is the solution for you! Check it out here:
http://epis.com/aurora_xmp/