
The following post is a case study of 8 Net Zero Energy Homes that were designed by South Mountain Company (SMC). SMC’s Marc Rosenbaum is teaching a class on Net Zero Energy Design that will give you all of the information and tools (Marc’s own custom made tools) to design Net Zero energy homes. The capstone project will be for you to submit a full design, including floor plans, energy models, shell designs, for a net zero energy home. Your design will receive feedback from Marc. Why is this awesome? Because it will provide you all the information you need to design future projects.
- Click here if you want to see students past capstone projects for the Zero Net Energy Homes course.
- Click here to watch a 26 minute video lesson calculating heat loss for net zero energy homes.
- Click here to sign up for the “Zero Net Energy Home” course.
If you’d like to download the case study, please enter your information below.
Copyright Odds and Ends
This article is the copyrighted property of South Mountain Company, Inc. West Tisbury, MA. It was represented with permission.
Please do not publish in entirety, in part, or quote, without express written permission. For permission, please contact John Abrams at jabrams@southmountain.com
PROJECT DESCRIPTION
The eight houses are grouped around a central pedestrian green with parking at the perimeter. All houses received LEED Platinum designation and all have permanent affordability restrictions. Each owner purchased the house and ground leases the property from the Island Housing Trust, a community land trust. One of the homes was constructed by Habitat for Humanity with technical assistance and guidance from South Mountain Company during the construction process. Half of the houses are three bedroom units of 1,447 sf and half are two bedroom units of 1,251 sf, all with full basements. The main living area and upstairs bedrooms and bath are identical in the two house types; the third bedroom is a north extension of the two bedroom plan. Designed and built to be net zero possible, they are all-electric homes with a 5.04 kW Sunpower solar electric (PV) array. They were occupied on June 1st 2010.
At the time, South Mountain announced the following contest to the new owners: each household that was able to go from June 1, 2010 thru May 31, 2011 at net zero energy use (or less!) would be awarded a year’s membership in the local Community Supported Agriculture (CSA) farm (Whippoorwill Farm) or a $400 gift certificate at a local fish market, the Net Result. After one year, two households have achieved zero annual net energy – using less energy than the PV array has generated. Two other households were very close: within ~1,100 kWh of reaching net zero.
ENVELOPE & SYSTEMS
The houses are superinsulated and have unobstructed southern orientation. Basements are within the thermal envelope, with R-20 walls and sub-slab insulation. Above-grade walls are R-31, roofs are R-50, (note, these are effective R values for the entire assembly) windows are triple glazed Thermotech with two layers low-e and argon fill, (south facing windows are coated with Energy Advantage low-e with a SHGC of 0.62, all others are 0.48) and the blower door results range from 117 to 184 CFM50 for the seven SMC homes and 236 CFM50 for the Habitat home. This is with no mechanical openings taped off and with the heat recovery ventilator running. These are superb numbers.
Heating and cooling is provided by a Daikin single zone minisplit heat pump (RXS24 DVJU) with a wall cassette in the main living area. Supplemental heating is provided by ceiling-mounted Enerjoy electric radiant ceiling panels. The houses are designed such that the single point source of heat – the heat pump – should be able to provide all the required heating, as long as the doors to the bedrooms are left open to allow heating by natural convection. The radiant panels allow heating in the event of a doors-closed operation, or to provide supplemental heating in extreme cold conditions.
Ventilation is provided by a constantly-operating Fantech 704 heat recovery ventilator. This unit draws about 30-35W and exhausts 25 CFM from each bathroom and supplies 15 CFM to each bedroom (in the case of the two bedroom unit, 15 CFM is also supplied to the living area.)
Domestic hot water (DHW) is supplied by a 50 gallon Marathon electric water heater. This tank is polybutylene lined and is insulated with two-and-a-half inches of closed cell foam.
METERING
In addition to the standard utility electric meter, each home has sub-metering of major components. They are:
- Minisplit heat pump
- Electric radiant panels
- DHW
- PV inverter output
- Water to the DHW tank
These sub-meters allow measurement of energy used for heating, cooling, DHW, and plug loads/lighting/ventilation, as well as the energy generated by the PV system. The meters are read monthly by Matt Coffey, who bought one of the homes and liked it so much, he now works at South Mountain as an architect.
PV PRODUCTION
The homes face very close to due south and have essentially full solar access. The Massachusetts Clean Energy Center (MA CEC) PV production calculator for these arrays estimates an annual output of 6,247 kWh. The average output of the eight systems was 6,873 kWh, nine percent higher than the estimate. We don’t know how much of this is due to better-than average solar insolation and how much is due to the premium SunPower product. Production exceeded the estimate for ten of the months, and fell short for two months. Figure 1 shows the estimated vs. actual monthly production:
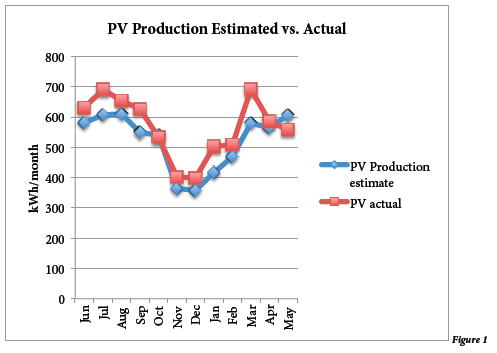
A key insight here is that estimates are only estimates – they are based on typical conditions and a set of assumptions. For example, the MA CEC production calculator uses Boston weather data, and we don’t know whether MV has more or less sun on average than Boston. The calculator assumes a DC to AC derate factor of 0.77, an industry standard, and Sunpower asserts that a higher value, 0.82, is the correct input for their product. Changing the derate factor from 0.77 to 0.82 yields an annual production estimate of 6,652 kWh, which is within two percent of the actual output of the eight systems. A second key insight is that monthly weather variations will typically exceed the annual weather variations. March 2011 production was close to twenty percent higher than the estimated value – it’s reasonable to assume that March was indeed sunnier than normal. May production was eight percent lower than estimated, so perhaps May was less sunny than normal (it sure seemed soggier…).
One home had the anomalous instance of a young child turning the exterior AC disconnect off during the latter portion of June 2010. It remained off for awhile before being discovered, causing that household to harvest only 279 kWh that month, as compared to an average from the other seven homes of 630 kWh. A key insight is that looking at monthly data means we catch these unique issues before they amount to much – one can imagine, in normal circumstances, that no one might catch that error for months if ever.
Variation in PV production from house to house is small. This is shown in Figure 2 below:
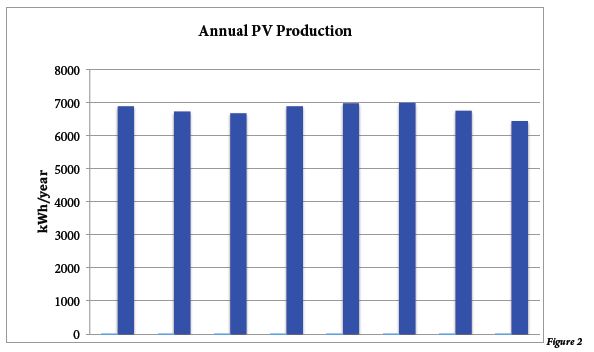
Lowest production is seen at houses 2, 3, and 8, and highest at houses 5 and 6. How much of this is variation is equipment performance and how much is light shading or off-south orientation is not clear.
Figure 3 shows the Google satellite view of the houses:
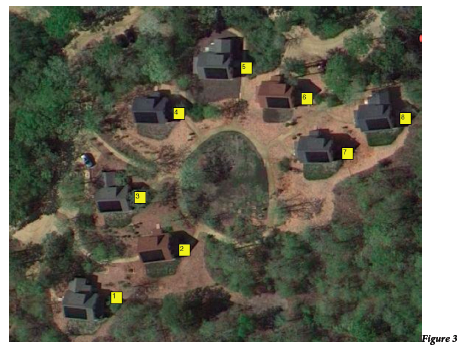
Lowest production is in the one house that has installed a satellite dish on the open portion of the roof adjacent to the PV array. It’s not clear how much, if at all, this dish shades the array.
ANNUAL ENERGY USAGE v PRODUCTION
The production of the PV array sets the total annual energy budget that a household can use if zero net energy is the goal.
Figure 4 shows the total annual energy usage of each home compared with the average PV production:
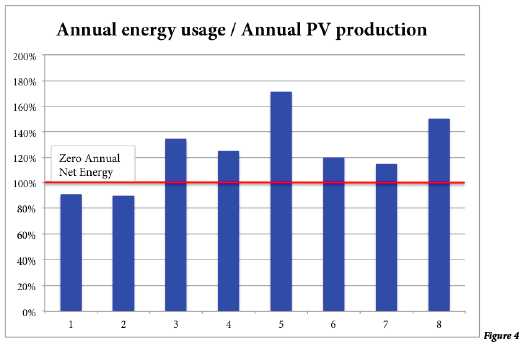
The figure shows that two households achieved zero annual net energy, and an additional two households had energy consumption that was within twenty percent of the PV production. Figure 5 shows the breakdown of total annual energy use by end use:
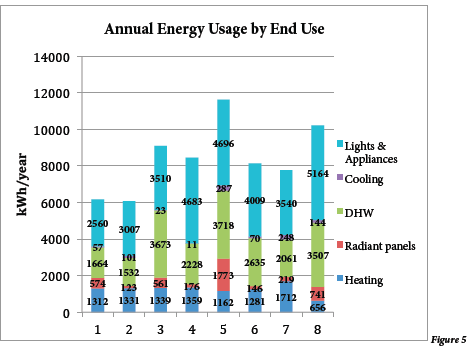
There is a lot of information in this figure. The meter that logs heat pump energy usage is covering usage for both heating and cooling. In the data analysis, I made the simplifying assumption that June, July, August and September usage was cooling, and all other usage was for heating. Lights and appliances usage is calculated for each household by subtracting the usage of the heat pump, the electric radiant panels, and the DHW heater from the total energy usage.
Key insights harvested from Figure 5 include:
- Cooling energy is small, yet it varies by a factor of twenty-six to one. It’s clearly discretionary energy – some folks use it, others hardly at all.
- With the exception of one house, heat pump energy is relatively even. The electric radiant panel energy ,however, varies by a factor of fourteen to one. Since the panels are much less efficient than the heat pump, it is in the occupants’ financial interest to minimize panel energy, but it may not be in their comfort interest to do so.
- Heating energy varies by a factor of two to one. If the highest and lowest usages are discarded (as in Olympic judging) the variation is much tighter – the next highest is thirty-five percent higher than the next lowest, and only thirty-eight percent higher than the lowest. The highest usage is fifty-two percent higher than the next higher usage. Do folks here leave the windows open? Do they keep the house warmer than others do? In this house, the panel energy is more than twice the amount used by panels in the next highest house – the heat pump energy used is second to lowest, so I don’t think that the heat pump is faulty, but perhaps it is worth checking after speaking with the occupants about their experience.
- DHW energy varies by a factor of 2.4 to one. This type of energy usage is much more linked to number of occupants than heating and cooling (see below)
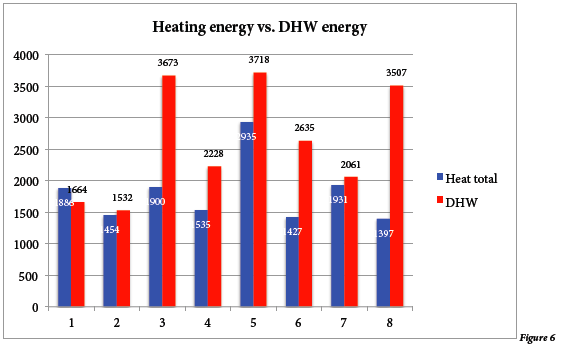
- In all but one household, DHW energy exceeds heating energy (see Figure 6 below). This is what happens in low energy use houses using heat pumps and electric resistance for DHW. It is clear to me that the next available investment in energy savings in these homes would be either solar thermal or a heat pump water heater!
- Plug and lighting loads vary by a factor of two to one. Although it is reasonable to expect that these loads increase somewhat with number of occupants, the second lowest users are a household of two adults and one infant.
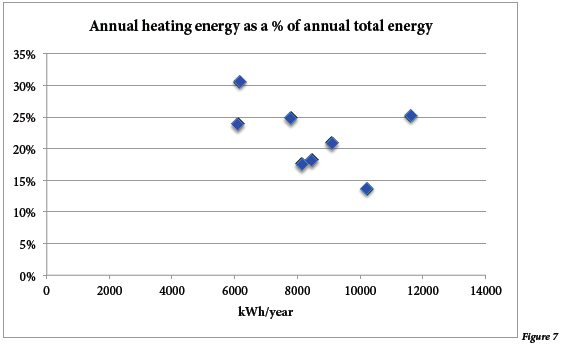
- Heating and cooling energy – that which is most reflective of the efforts of the design and construction process – is a small percentage of the total energy usage. As Andy Shapiro says, there is no such thing as a net zero house, only net zero families. Occupant choice matters hugely. See Figure 7. The two net zero households have the highest percentage of total energy as heating energy, because their DHW and plug/lighting usages are smaller, yet even in these cases the heating energy is less than one third of the total.
HEATING ENERGY (IN MORE DETAIL)
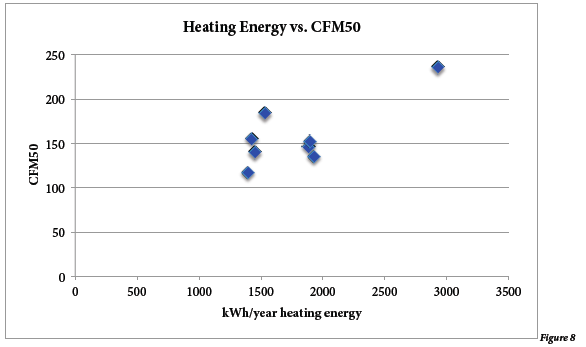
There was not a large variation in air tightness amongst this sample of buildings. One might expect heating energy to be correlated with air tightness. Figure 8 shows this data. The correlation is present, but weak. The leakiest house is also the one that has the highest heating energy, yet it is still an impressively tight house, and proportionally the heating use seems much higher than the others compared to how much leakier the house is.
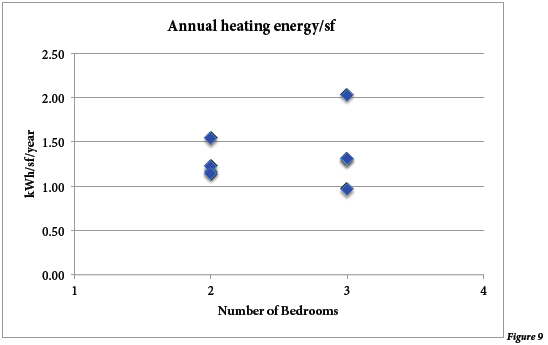
One might expect a higher energy usage per square foot of floor area in the three bedroom homes, due to the disproportionally increased shell area of the third bedroom, which is a first floor ell.
Figure 9 shows that this appears to not be the case, especially if one discards the highest heating use house.
What is a clear trend is the proportion of electric radiant panel usage in the two vs. three bedroom homes. Figure 10 shows that the three bedroom homes used significantly more panel energy. Panel energy is likely to increase when interior doors to the bedrooms are closed, hindering natural convective transfer of warm air from the main space, where the heat pump is located. Possible reasons include:
- The third bedroom might be used as the master bedroom and the door to the bedroom might be closed more than the doors to the upstairs bedrooms are in the two bedroom houses.
- The three bedroom houses have more occupants on average, so perhaps the doors in general are more often closed for privacy reasons.
- The third bedroom has more heat loss than the upper bedrooms in relation to the heat gain from both natural convection and conduction through shared interior walls and floors, so perhaps people feel cooler in the third bedroom.
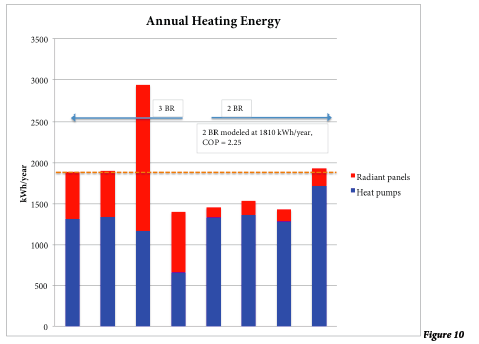
Another key insight from this data is that our energy modeling is reasonably robust. With a combined (heat pumps and radiant panel guesstimate) Coefficient of Performance (COP) of 2.25 we modeled the two bedroom house as using 1,810 kWh/year for heating, and the four two bedroom houses averaged 1,587 kWh/year, twelve percent lower than predicted. The three bedroom homes averaged 2,030 kWh/year for heating, and if the high user is discarded, the number is 1,728 kWh/year, or nine percent higher than the two bedroom units.
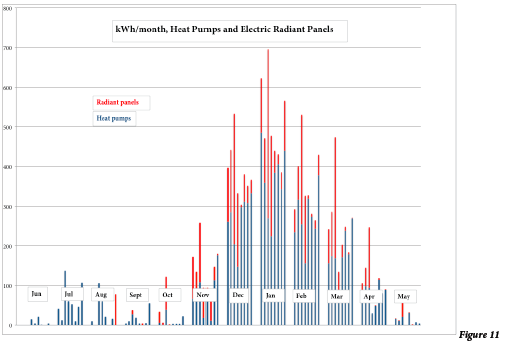
Figure 11 shows the monthly usage of both the heat pump and the electrical radiant panels for heating.
CORRELATIONS WITH NUMBER OF OCCUPANTS
One expects some types of energy usage to scale more with number of occupants than other types. A house doesn’t need more heat due to more occupants, and in fact, the internal gains associated with more occupants can drive heating energy down. The home with the highest light and appliance energy usage had the lowest heating usage, but this was not a general trend. DHW energy used and energy used for lights, appliances, and entertainment is a function both of number of occupants and the choices they make. Figure 12 shows annual total energy usage vs. number of occupants:
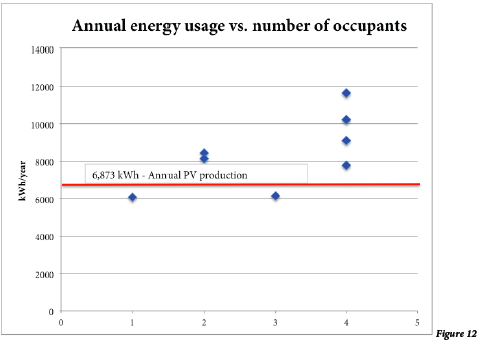
The net zero households have one and three occupants. The four households with four occupants have a total energy usage that varies by a factor of 1.5 to one. One household with four occupants uses slightly less energy than the two houses with two occupants.
Figure 13 shows light and appliance energy usage vs. number of occupants
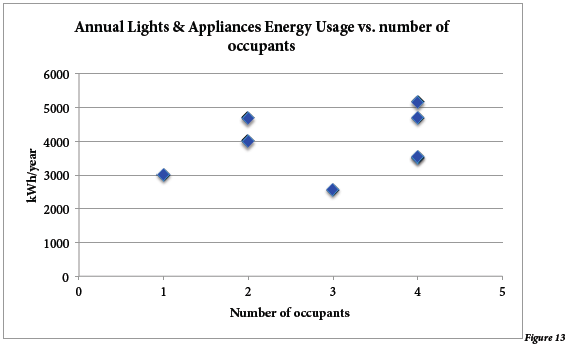
A key insight is that lights, appliances, and entertainment energy usage is perhaps the most discretionary of all, and this chart shows the lowest usage by a household of three, and that the households of two and four have a similar average usage. Amongst the households of four, this category of energy usage varies 1.5 to one.
DHW usage also varies significantly in gallons of DHW used daily per occupant.
The range here is a factor of three to one, as shown in Figure 14:
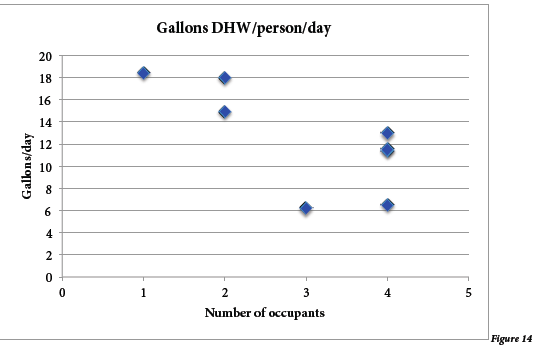
Age of the occupants must matter – there is the stereotype of the thirty minute teenage shower. There are also other factors – how much a household prepares their own food, how active they are, whether most of them are bald and therefore can take quick showers (like me!).
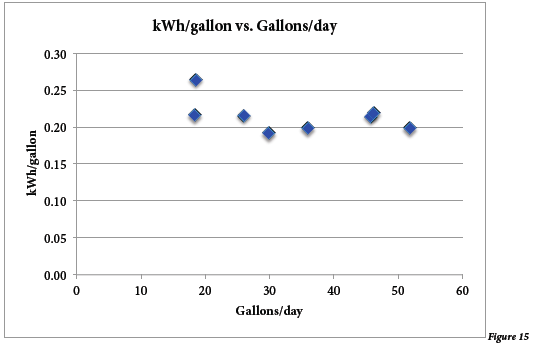
DHW SYSTEM ENERGY
We are fortunate to have water meters on the inlet to the DHW tanks, as well as the kWh meters. This has permitted us to look at how much energy is being used per gallon to heat water. In Figure 15, the energy per gallon is plotted against gallons of DHW used daily. It is expected that the standby losses off the DHW tank would be close to constant no matter how much DHW is used, and that lower DHW users would use more energy per gallon than high users. In fact, this appears to be untrue, with the exception of one household. Perhaps the temperature setpoint of the
DHW tank is higher in this household. Overall, the DHW systems are using an average of 0.21 kWh/gallon of DHW. If the temperature rise averages 70F in the tank, this is a system efficiency of 81%. If the rise is 80F, the efficiency is 93%.
MONTHLY DATA
It is interesting to look at which months households were electricity exporters and which months they needed to import a net quantity of energy from the grid. Every household achieved at least one month where they were a net exporter. All households were net importers in the four coldest and cloudiest months. As a neighborhood, the total annual net import was 13,680 kWh.
Figure 16 shows this information:
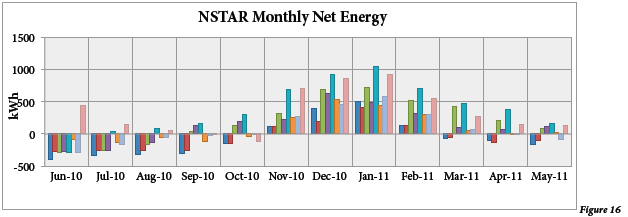
Figure 17 below shows the monthly output of the eight PV systems. The minimum is in November and December and the maximum is in July, although March was an excellent month. The short bar in June on one house is the result of the young child throwing the AC disconnect off, as mentioned.
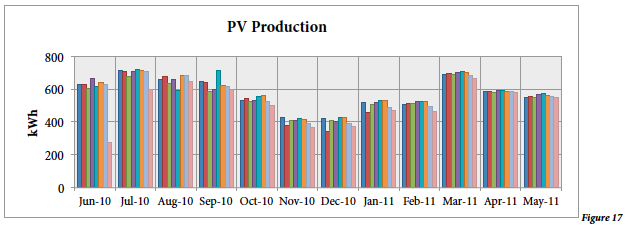
Figure 18 shows monthly total energy usage of the eight households. As expected, it peaks in the winter heating season.
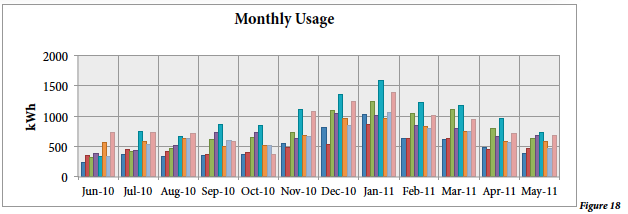
Figure 19 below shows the energy into the minisplit air source heat pumps. I’ve assumed that energy input during June through September is cooling and all else is heating. Heating peaks in January, the coldest month in most years, and cooling peaks in July, which had the most hot and humid weather.
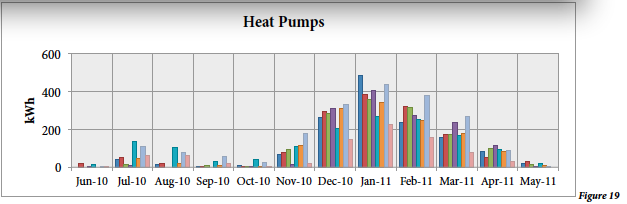
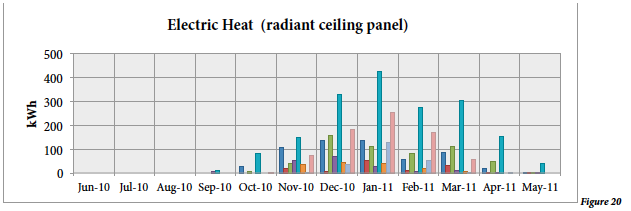
Figure 20 shows the monthly energy input to the electric radiant ceiling panels. A similar January peak is evident, and the dramatically higher usage by one household of these heaters stands out.
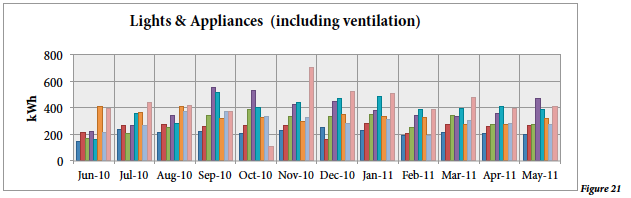
Lights and appliances, shown below in Figure 21, vary by household but are only mildly winter peaking, which makes sense, as all heating energy is captured in the heat pump and radiant panel graphs, unlike fossil fueled equipment, which uses electricity as well as fossil fuel and therefore increases winter electrical usage. Peaks here likely represent increased lighting, and perhaps more time spent indoors using entertainment equipment in the winter.
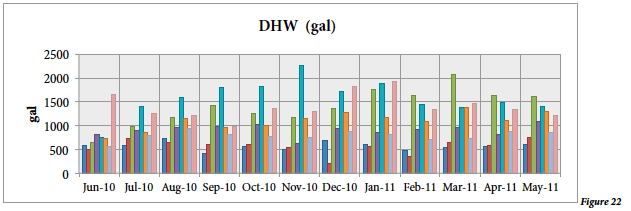
The next three figures, 22 through 24, are related to DHW. In the first, gallons of DHW per month are shown. Some households are remarkably consistent in their usage month to month, others vary noticeably. It’s possible that the number of occupants changes.
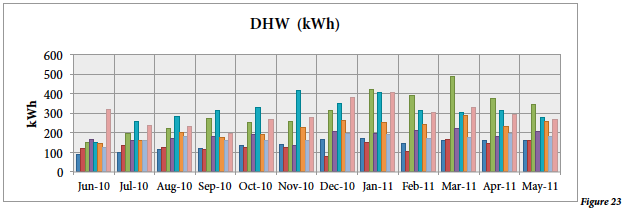
Not surprisingly, the energy used to heat water follows the quantity of water heated rather closely!
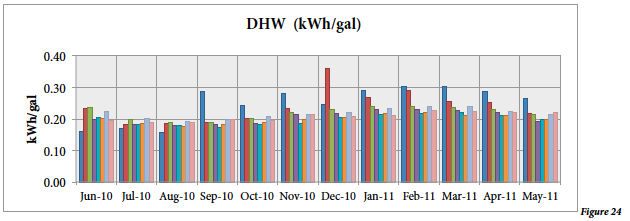
Electricity use per gallon of DHW is relatively even across the households, although one of the two households that used the least DHW is using substantially more energy per gallon than other households. We should check to see if this household’s DHW tank is set at a higher temperature than other households.
The next figure (24) demonstrates that the energy used to heat water per gallon increases as the weather gets colder, and lags the coldest air temperature, as the ground cools more slowly than the air as fall and winter occur, and heats more slowly in the spring.
CONCLUSION
We are very fortunate to have this sample of low energy housing so close by and so well-equipped with good metering. The unusual numbers of monitoring meters – carefully and consistently read – makes this kind of detailed analysis possible. The summary of all the key insights contained in the complete report is that “there are no zero-energy houses, only zero-energy families.” But there are a number of key lessons that we can use to make our future projects even better, and there are a number of key lines of inquiry and questions raised by this data that we can use to learn still more about high-performance housing.
We are pleased with these results. This is a superb example of housing that is “truly affordable forever.” The real value of these homes will become apparent over time, as they require little or no expenditures for rising energy costs and will incur very low maintenance costs. The owners of these homes have built-in “risk protection” that few other homeowners do. We hope the data we have gathered and the lessons we have learned will help others in the important pursuit of high performance housing for the 21st century.


[…] ← Full Case Study of 8 Net Zero Energy Homes […]
[…] Click here to read a case study of 8 net zero energy homes designed by Marc’s company, South M… […]
[…] Click here to read a case study of 8 zero net energy homes 1 year after construction. […]